Technical Analysis: How to Read Stock Market Trends
Understanding market trends is crucial for investors and traders seeking to make informed decisions in the stock market. Two popular methodologies for analyzing stocks are technical analysis and fundamental analysis. While fundamental analysis focuses on evaluating a company’s financial health and intrinsic value, technical analysis is centered on studying past market data, primarily price and volume, to forecast future price movements.
The Basics of Technical Analysis
Technical analysis is predicated on the belief that historical trading activity and price changes of a security can be strong indicators of its future price movements. The primary goal is to identify trends, reversals, and potential price targets.
Key Concepts in Technical Analysis:
1. Trends: The direction in which a stock is moving. Trends can be upward (bullish), downward (bearish), or sideways.
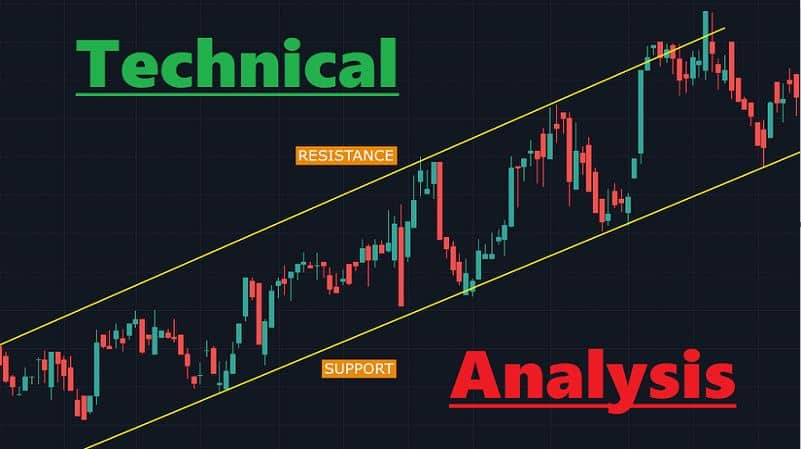
2. Support and Resistance Levels: Prices at which stocks consistently stop and reverse. Support is a level where a stock’s price tends to stop falling, while resistance is a level where its price tends to stop rising.
3. Moving Averages: These smooth out price data to identify trends over a given period. Commonly used moving averages are the simple moving average (SMA) and the exponential moving average (EMA).
4. Indicators and Oscillators: Tools like the Relative Strength Index (RSI) and Moving Average Convergence Divergence (MACD) help identify momentum, volatility, and potential reversal points.
Reading Stock Market Trends
Identifying Trends
Trends form the foundation of technical analysis. They are evidenced by peaks and troughs in price action. For example, an upward trend is illustrated by a series of higher highs and higher lows. Conversely, a downward trend consists of lower highs and lower lows.
Calculating Trend Lines:
To draw a trend line, connect two or more price points on a chart. For upward trends, connect descending troughs. For downward trends, connect descending peaks. The more times the price touches the trend line, the more reliable it is considered.
Utilizing Moving Averages
Moving averages help smoothen price data, thereby revealing the underlying trend. A popular use of moving averages in trend analysis is the moving average crossover. For example, a bullish crossover occurs when a short-term moving average crosses above a long-term moving average, suggesting an upward trend.
Example Calculation:
Imagine a 10-day SMA for a stock, given its closing prices over 10 days (in INR): 50, 52, 54, 55, 53, 51, 56, 58, 57, 60.
To calculate the 10-day SMA:
\[ \text{SMA} = \frac{50 + 52 + 54 + 55 + 53 + 51 + 56 + 58 + 57 + 60}{10} = 54.6 \text{ INR} \]
This average can be plotted each day to visualize the momentum and potential trend shifts.
Oscillators and Indicators
Relative Strength Index (RSI):
The RSI measures the magnitude of recent price changes to evaluate overbought or oversold conditions. It oscillates between 0 to 100, with levels above 70 indicating overbought conditions and levels below 30 suggesting oversold conditions.
Moving Average Convergence Divergence (MACD):
MACD is a trend-following momentum indicator that shows the relationship between two moving averages (usually 26-day and 12-day EMAs). A bullish signal is generated when the MACD line crosses above the signal line.
Technical Analysis vs. Fundamental Analysis
While technical analysis emphasizes patterns and past price movements, fundamental analysis involves scrutinizing a company’s earnings, revenue, growth prospects, and economic factors. Investors often use a combination of both to gain a comprehensive view.
Practical Consideration and Highlights
1. Volume Analysis: Volume helps confirm trends and chart patterns. A strong trend should be accompanied by increasing volume.
2. Chart Patterns: Patterns like head and shoulders, flags, and triangles help predict potential price movements.
3. Risk Management: Use stop-loss orders to limit losses. For instance, setting a stop-loss at a 5% drop may protect against unexpected downturns.
4. Timeframes: Customize analysis using different timeframes (daily, weekly, monthly), but be mindful of differing levels of volatility and noise.
Examples of Application
Case Study: Stock X
Consider Stock X, trading at INR 1,000. Recently, the stock formed an upward trend with higher highs at INR 1,050 and INR 1,100 and higher lows at INR 980 and INR 1,020. By drawing a trend line connecting these points, investors could anticipate future upward movements should the trend persist.
Analyzing with Moving Averages:
Stock X’s 50-day EMA crosses above its 200-day EMA, indicating a golden cross — a bullish signal suggesting further price increases.
Example in Context
Suppose a technical analyst uses RSI on Stock Y, with recent RSI levels oscillating around 75. This suggests overbought conditions. Combined with a descending trend line resistance, this could predict imminent price corrections.
Conclusion
Technical analysis is a valuable method for interpreting market data, observing trends, and making projections based on historical price actions. Although it offers useful insights into price movements, using the Bajaj Finserv App can enhance analysis by providing real-time data. It’s essential to pair technical analysis with other approaches like fundamental analysis to evaluate stocks comprehensively. Investors should consider the nuances of both methodologies for better decision-making.
Disclaimer: This article serves as an educational resource and should not be considered trading advice. Market activities involve significant financial risks, and investors must gauge all the pros and cons when participating in Indian stock market trading. Always consult with a certified financial advisor before making investment decisions.


Post Comment